fviz
Facebook Data Visualizer - made with <3
Released v1.0.0 on PyPI
vision
I was interested in understanding my facebook activity i.e.
- How much time I’m spending on facebook
- Which quarter of day I’m mostly active on facebook
- Which are those profiles, I’m mostly interacting with
- What’s my facebook friending rate
- How has my facebook browsing behaviour changed overtime etc.
Also I had a knack in checking how much data I’m giving to facebook. So, I thought of analysing exported facebook data and understanding what it is saying.
Later on I thought of making this tool a portable and easy installable one. So that anyone with some simple installation skills can use this tool and generate several plots, and understand their own facebook activity.
This tool does strictly run on user’s machine. It doesn’t talk to any remote machine, so you can use it safely by feeding it your exported facebook data.
installation
fviz can be installed using pip. Also make sure you’ve Python ( >=3.7 ).
$ python3 -m pip install fviz -U
Note: Add your default pip installation location to system PATH variable, so that you can invoke fviz from anywhere in system.
data
You can download your copy of facebook data as JSON, by following these instructions.
Note: fviz only supports JSON data format.
usage
sink is the directory where this .zip to be extracted. And plots is the directory where generated plots to be placed. You can set them as you will.
$ fviz facebook-userid.zip sink plots
features
All these plots to be generated when you invoke fviz with proper params.
- Likes and Reactions
- Facebook Likes & Reactions by You
- Top 10 Facebook profiles, whose posts were mostly reacted by You
- Detailed Facebook Likes & Reactions HeatMap
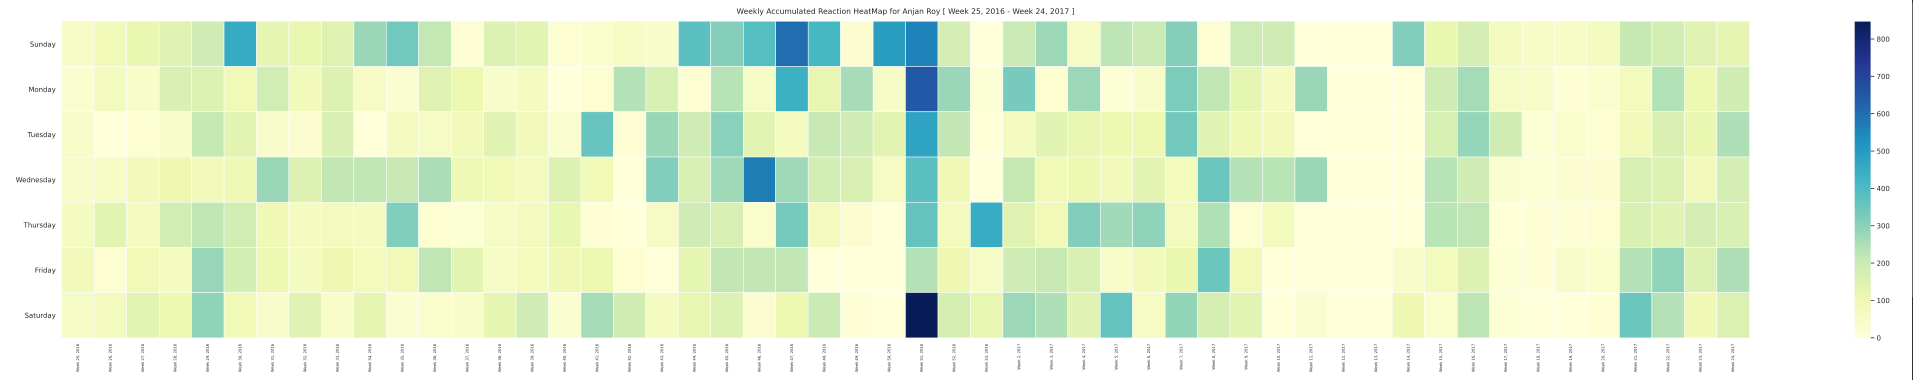
- Weekly Accumulated Facebook Likes & Reactions HeatMap
- Top 3 Facebook profiles, whose posts were mostly liked & reacted by YOU, per month
- Accumulated Facebook likes and reactions mapped onto each minute of a Day
- Friends
- Comments
- Messages
- Misc
This section will keep getting populated !!!